Tutorial
Simulating IICR plots using ms
Published 2018-01-01
In this tutorial we reproduce some of the IICR plots from Chikhi et al. (2018). The original page did not carry a separate publication date; the date used here is the journal publication year of the paper being reproduced.
What you need
- A working version of
ms.- Compile
msfrom Hudson’s source page.
- Compile
- A working Python environment with NumPy. One common option is Anaconda.
- The Python script that computes the IICR from (T_2) values produced with
ms, from IICREstimator:
git clone https://github.com/willyrv/IICREstimatorTesting whether ms is working
Put a compiled version of ms in the folder containing the Python scripts. Then open a terminal in this folder and type ./ms on Linux or ms on Windows.
You should get an output having something like this in the first lines:
Too few command line arguments
usage: ms nsam howmany
This is an error message, but it shows that ms is working.
The configuration file
Scenarios for simulation are specified in a configuration text file. The path to this file is specified when we run the script. The configuration file is in JSON format. Start with parameters_tutorial.json. Line 4 looks like:
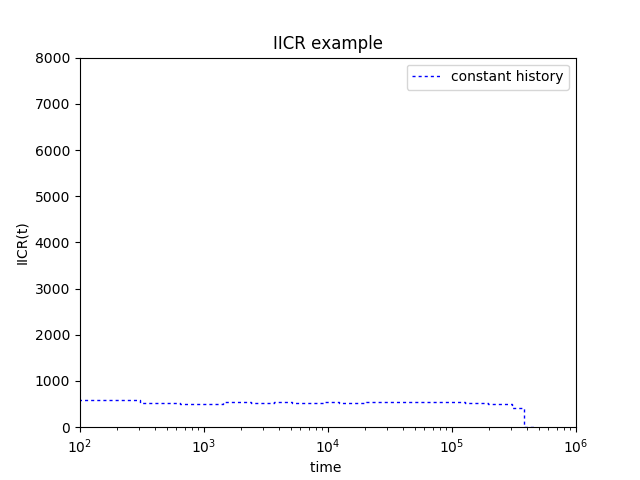
{"ms_command":"ms 2 1000000 -T -L",The command after the colon is an ms command corresponding to a population with constant size. From the folder containing the Python scripts run:
python ./estimIICR.py ./parameters_tutorial.jsonYou should get a figure like this:
Now change the ms command in order to simulate data under a different scenario. Replace line 4 by:
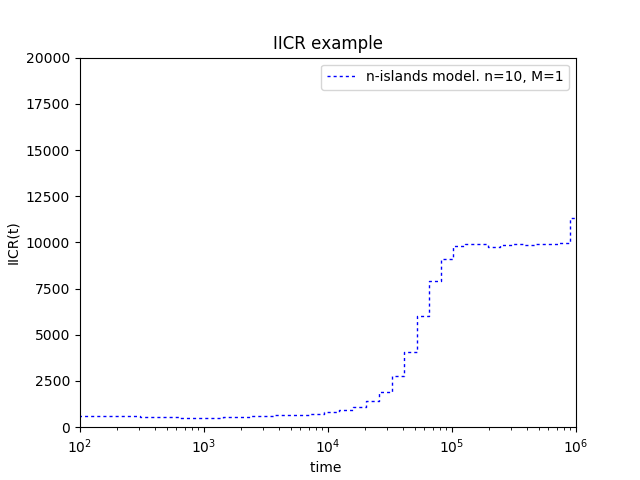
{"ms_command":"ms 2 1000000 -T -L -I 10 2 0 0 0 0 0 0 0 0 0 1",This is the corresponding ms command for simulating (T_2) values under an n-islands model with ten demes and gene flow equal to 1. You can also change the label for the plot and the plot limits so that the IICR fits well inside:
"label":"n-islands model. n=10, M=1",
"plot_limits": [1e2, 1e6, 0, 0.8e4],
You should obtain a graphic like this:
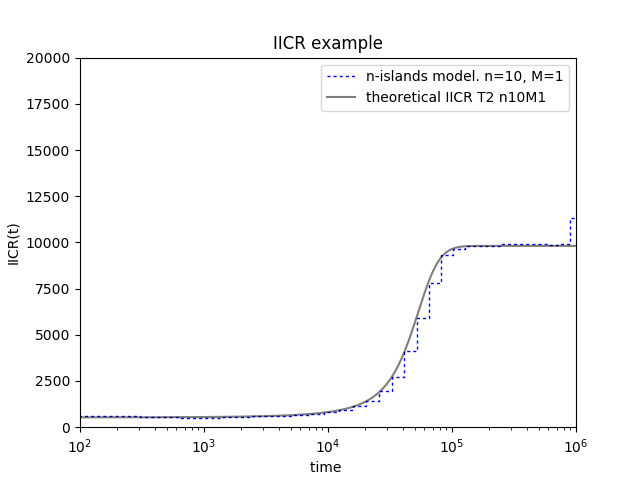
It is also possible to plot the theoretical IICR for a given n-islands model. In the original tutorial this was done by setting "plot_theor_IICR": 1 and specifying n and M in the theoretical-IICR block. After saving the file and running the script again you should obtain:
Recap
- Parameters are specified in a JSON file, originally named
parameters_tutorial.json, in the same folder asestimIICR.py. Remember to save changes after any modification. - You need a working version of
msin the same folder as the Python script. - Scenarios can be specified by
mscommands. It is possible to plot the IICR of any scenario that can be translated into anmscommand.
The supplementary PDF of Chikhi et al. (2018) contains further ms commands starting in section 4. See also the IICR project page.